Visualize
Make Your Data Actionable Faster

Visualize. Interoperate. Expedite Workflows.
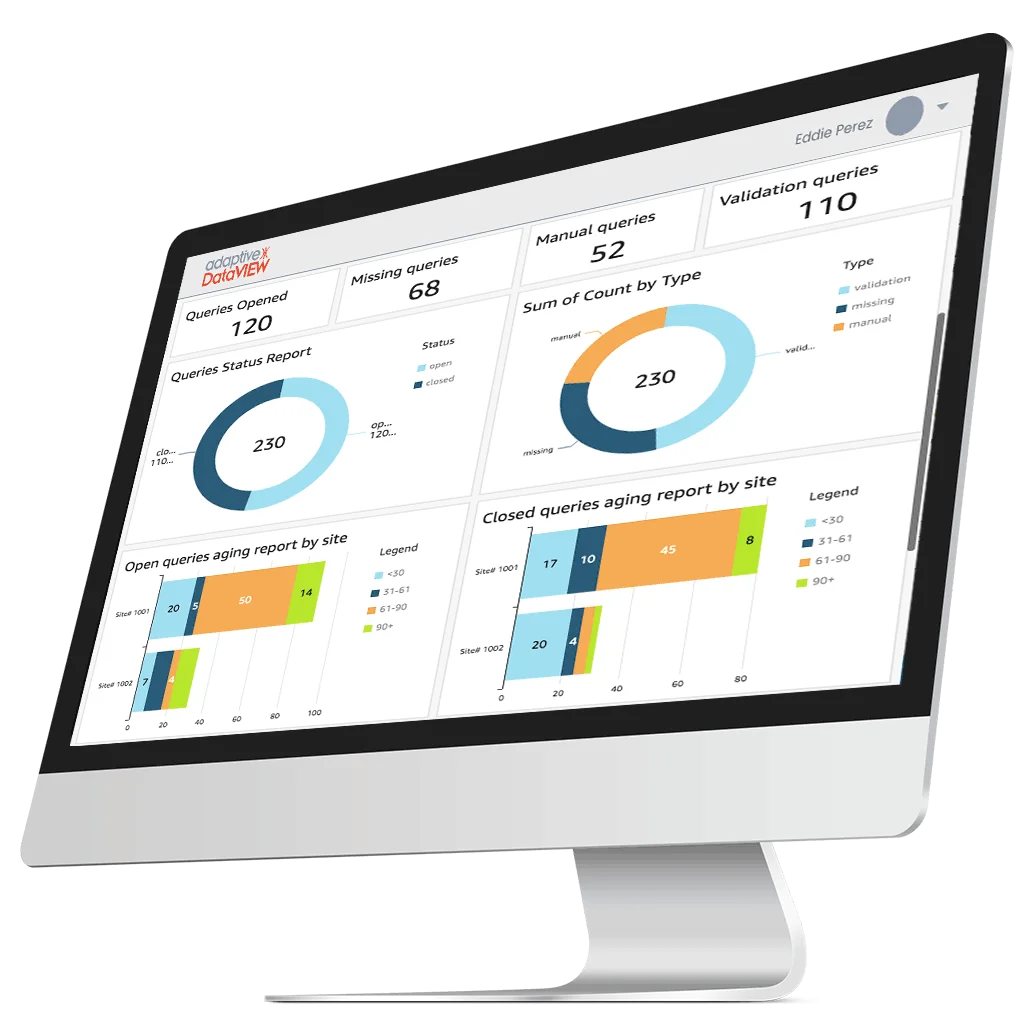
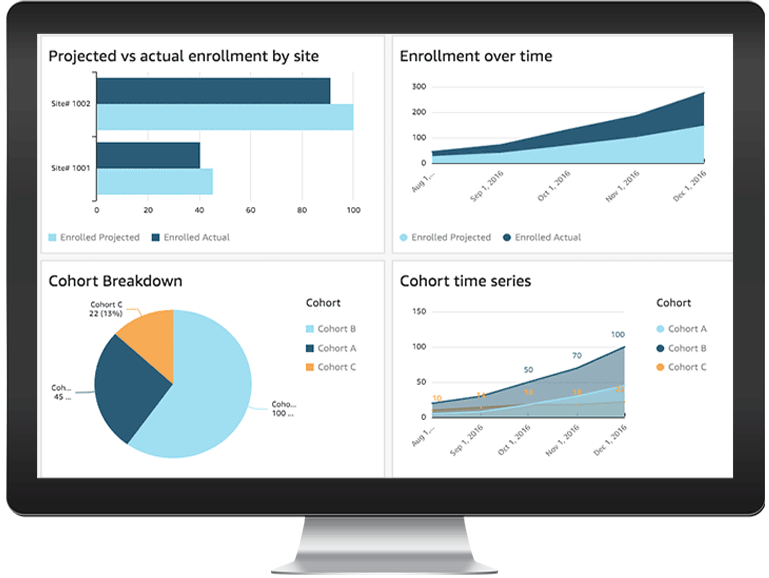
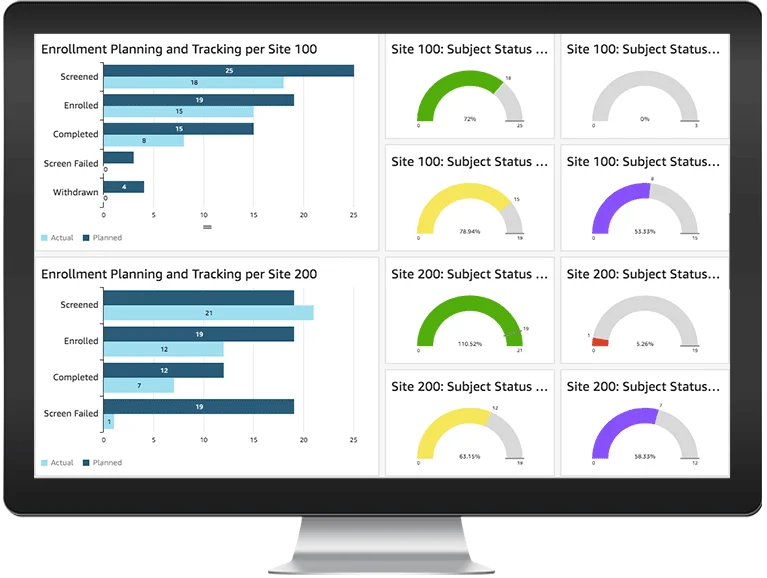
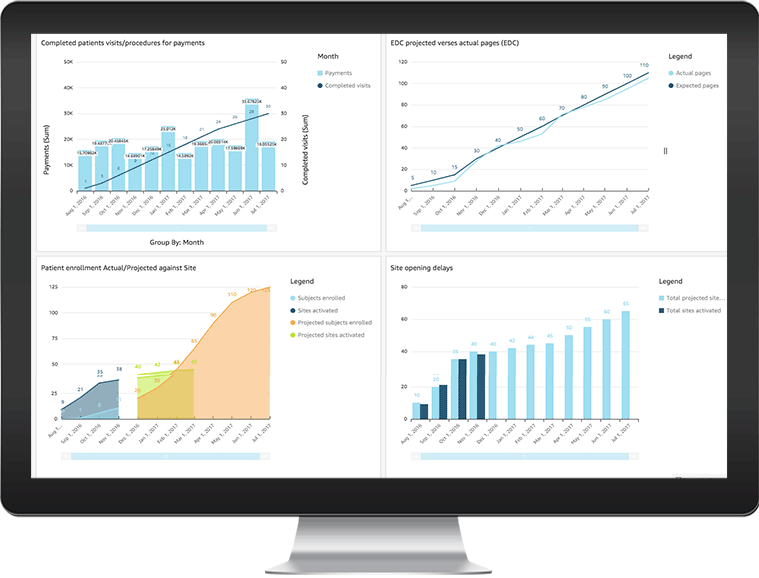
As decentralized clinical trials become more complex, Adaptive DataVIEW provides a holistic access to all your data from internal as well as external (CRO) data via interactive reporting and visualization. In addition to drill downs, Adaptive DataVIEW has a unique “single click-back” feature to the data source.


Make Your Data Actionable Faster
Adaptive DataVIEW extends the capabilities of the Adaptive eClinical Bus even further. As decentralized clinical trials become more complex, Adaptive DataVIEW provides easy aggregation of all data, cleaned, harmonized and ready for interactive reporting and data visualization.
Get to the Source with “Single Click-back”
The solution is scalable and integrates with the Adaptive eClinical Bus to provide secure access to all data management resources. Adaptive DataVIEW is the only bi-directional dashboard that enables “single click-back” from any widget or dashlet to the data source, regardless of tool. This allows for a one-click jump to the source for outliers to save time and enhance teamwork through widget or dashlet sharing. This solution is purpose built for clinical trial operational dashboards, and is a SaaS offering with no additional IT support required.


Visualize and Operationalize Internal as well as External Data
With Adaptive DataVIEW, any data source can be ingested in real-time. Reports and dashboards can be generated at the patient, site, study and program level. Sponsors and CROs can incorporate legacy data into operational dashboards without the need for convoluted data import and harmonization. Customers can add new systems and legacy data sources to maintain flexibility in selecting best of breed partners while leveraging existing investments.
Learn More about Adaptive DataVIEW™
Key DataVIEW™ Features
Single “Click-Back” enables you to launch into the data source to inspect data elements. With one click, view any data point at the point of origin.
Change, create and organize dashboard.
Fully customizable portal including options for dashlets, logo, background, and color palette.
Create reports at the patient, site, study, and program level.
Choose widgets on dashboards and combine data from various source systems and vendors.
Inspect data elements from any dashboard. View any data point at the point of origin.
